In a true VR application, user is cut off from his surroundings. In such a case along with user gaze (where he/she is looking in the content) his movement also becomes important in understanding his behaviour. Using heatmaps are a good choice to visualize movement data.
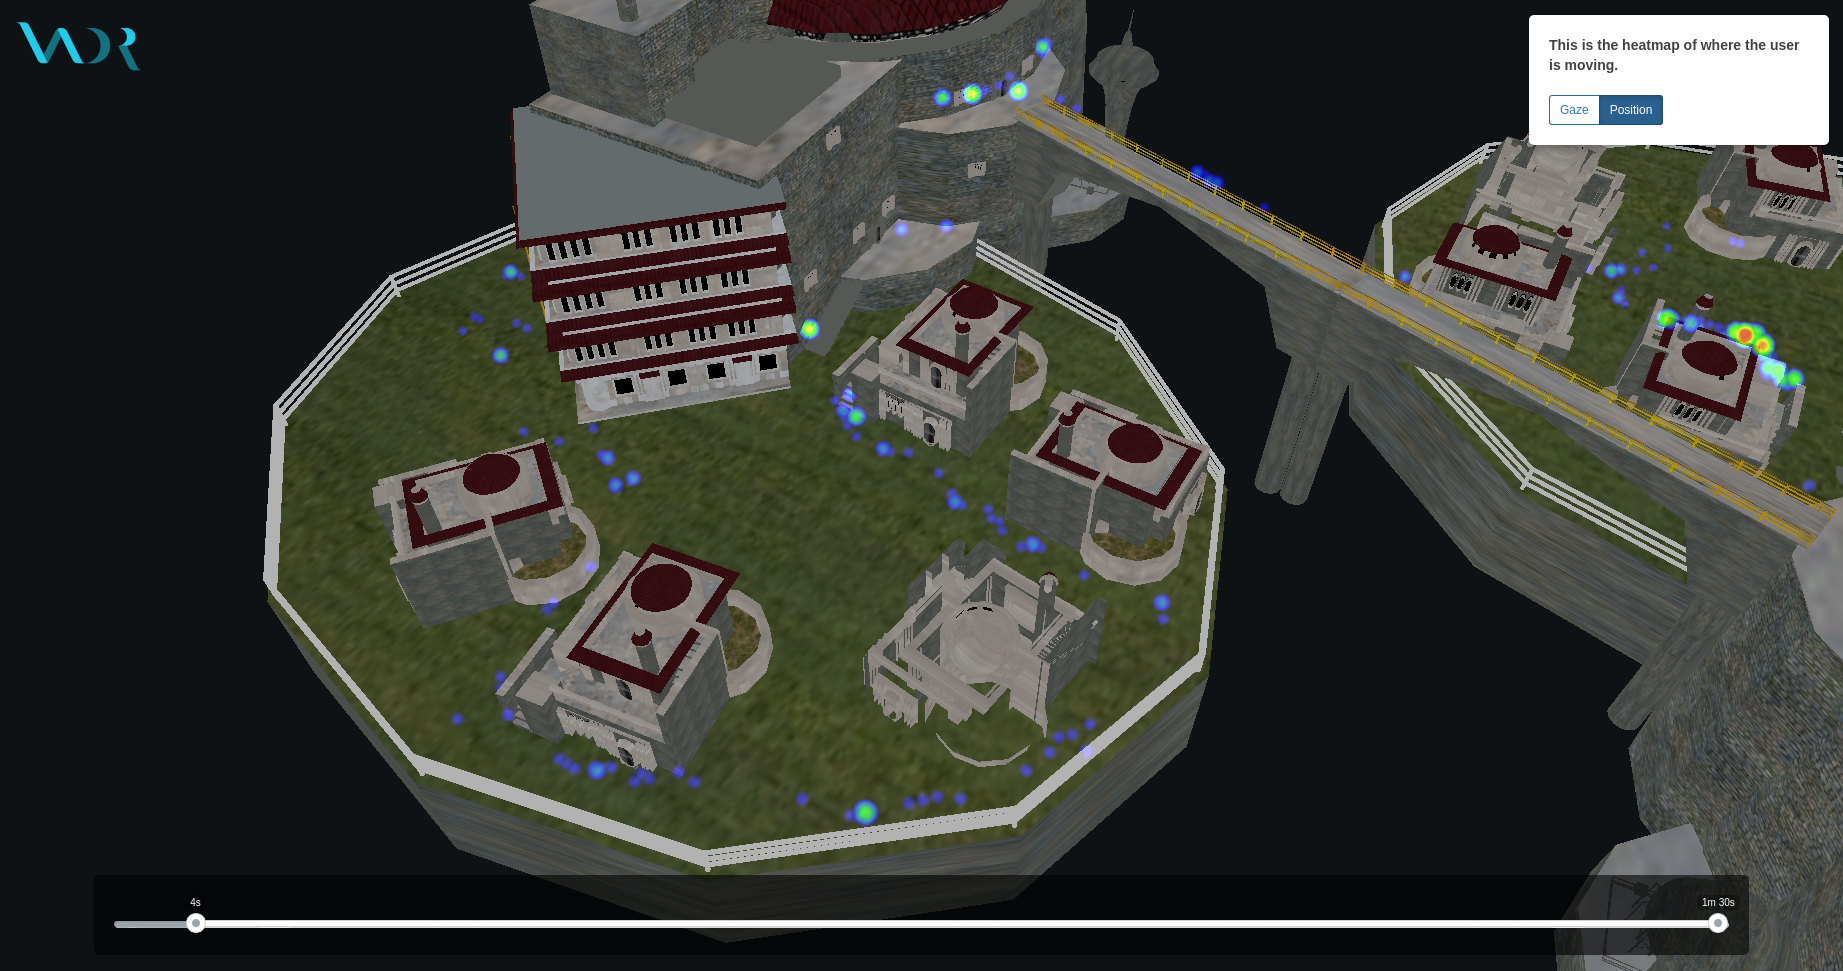
Fig.1 : User Position Heatmap
Using these heatmaps you get to know where users are stopping and spending time. You can also get the idea of how many users are in a given region, but you don’t get to know which paths users followed. That is why we introduced movement maps. Movement maps shows the path of the users represented by lines. The color and thickness of the lines specify which paths are more followed. Further, users’ stop points are shown by clusters. This enables us to understand the most important points and path taken to reach certain location in a single map. Movement maps can also help in debugging a specific bug where a developer forgot to put a collider on an object and users are falling off.
In the example below we took a fantasy fortress and measured user movements. With movement maps we were able to know the exact paths taken by all the users. We were able to know that some users are generally walking near the houses present. Further we are also able to know the two stop points one on the left corner and one on the bridge.
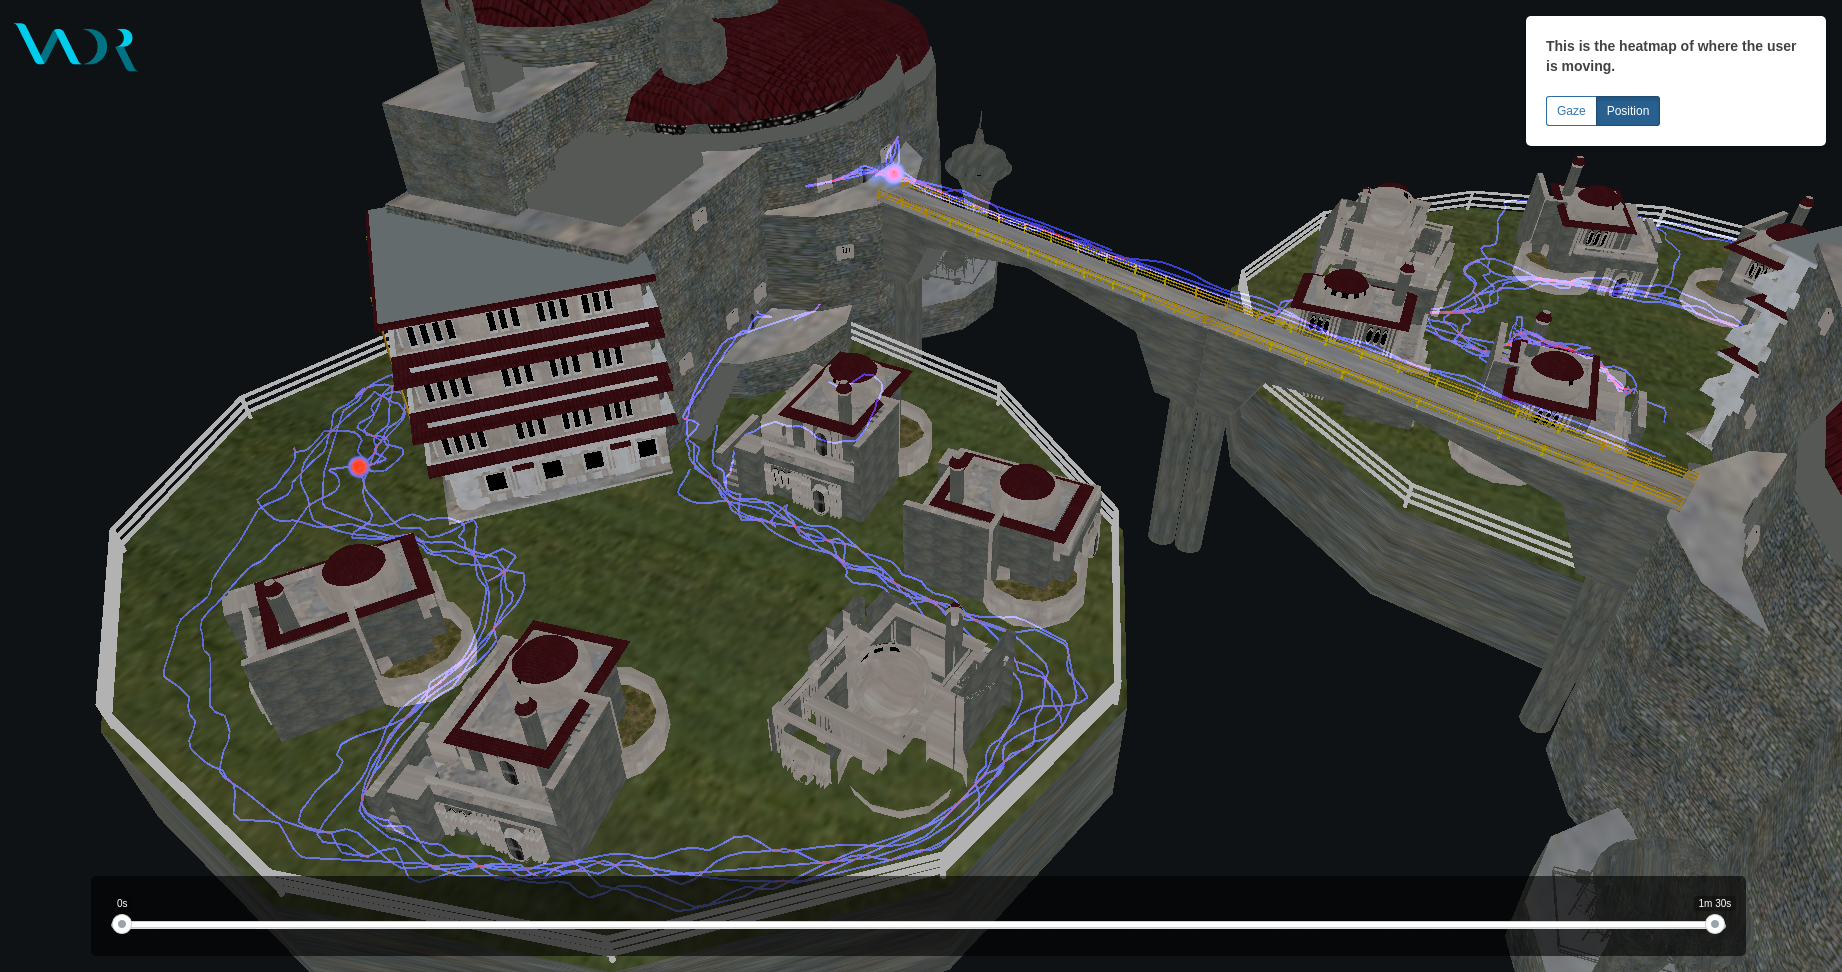
Fig.2 : User movement map
Movement map is one of the many exciting features of the VadR’s complete analytics platform. We are continuously be bringing new features to help developers gain insights from their users.