Virtual Reality is fundamentally different from web or mobile content. Virtual Reality offers more user interaction than any other form of content. While using VR content user is cut off from the real world. In such a case users’ spatial information becomes lot more important in understanding his behaviour. Hence VR gives us an opportunity to collect unprecedented level of data to measure user behaviour. This data should be represented in a manner which makes interpretation very easy and helps in understanding user engagement. The traditional method of representing data via graphs used for web or mobile are not enough to interpret data generated in VR content. Hence there is a need for new tools and methods.
One such tool at our disposal is Heatmaps. Heatmap is a graphical representation of data where the individual values are represented as colors. When a heatmap is overlaid on the 3D model, it provides spatial information about the density of events. Heatmaps are also a lot more visual than standard analytics reports, which make them easier to analyse at a glance. This makes them more accessible, particularly to people who are not accustomed to analysing large amounts of data.
How to select the right type of heatmap?
When we hear about heatmaps, data represented by rainbow colors comes in our mind. But heatmaps are of varied kind and depending on the data to visualize the right type should be selected to get maximum benefits. I’ll explain some of the heatmaps content creators used (though there can be other kind as well).
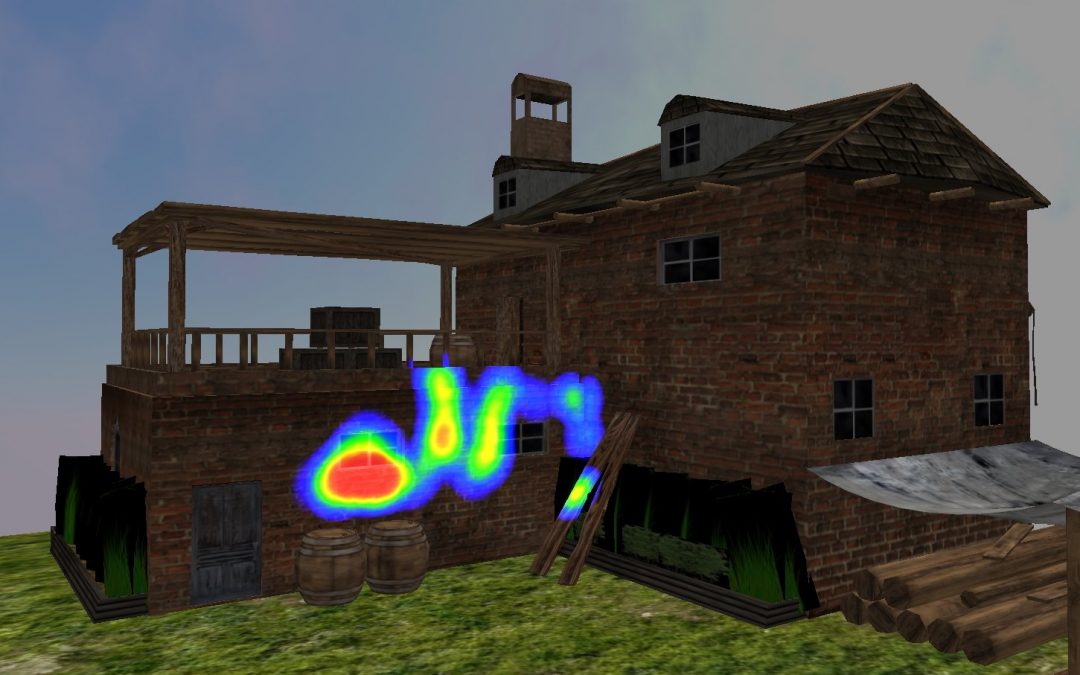
- Surface Map – In surface maps color represent the intensity of data being plotted. Generally red represent the maximum intensity and blue the least. Surface maps are ideal for plotting metrics like user gaze, where information (where user looked) falls on the surface of a 3D object. Plotting gaze data help us to understand which objects grabbed users’ attention most. In the application Kill Terrorist VR, using gaze data developers understood users were not paying attention to billboards in the scene hence they were able to change the location of these billborads where they were better received by the users.
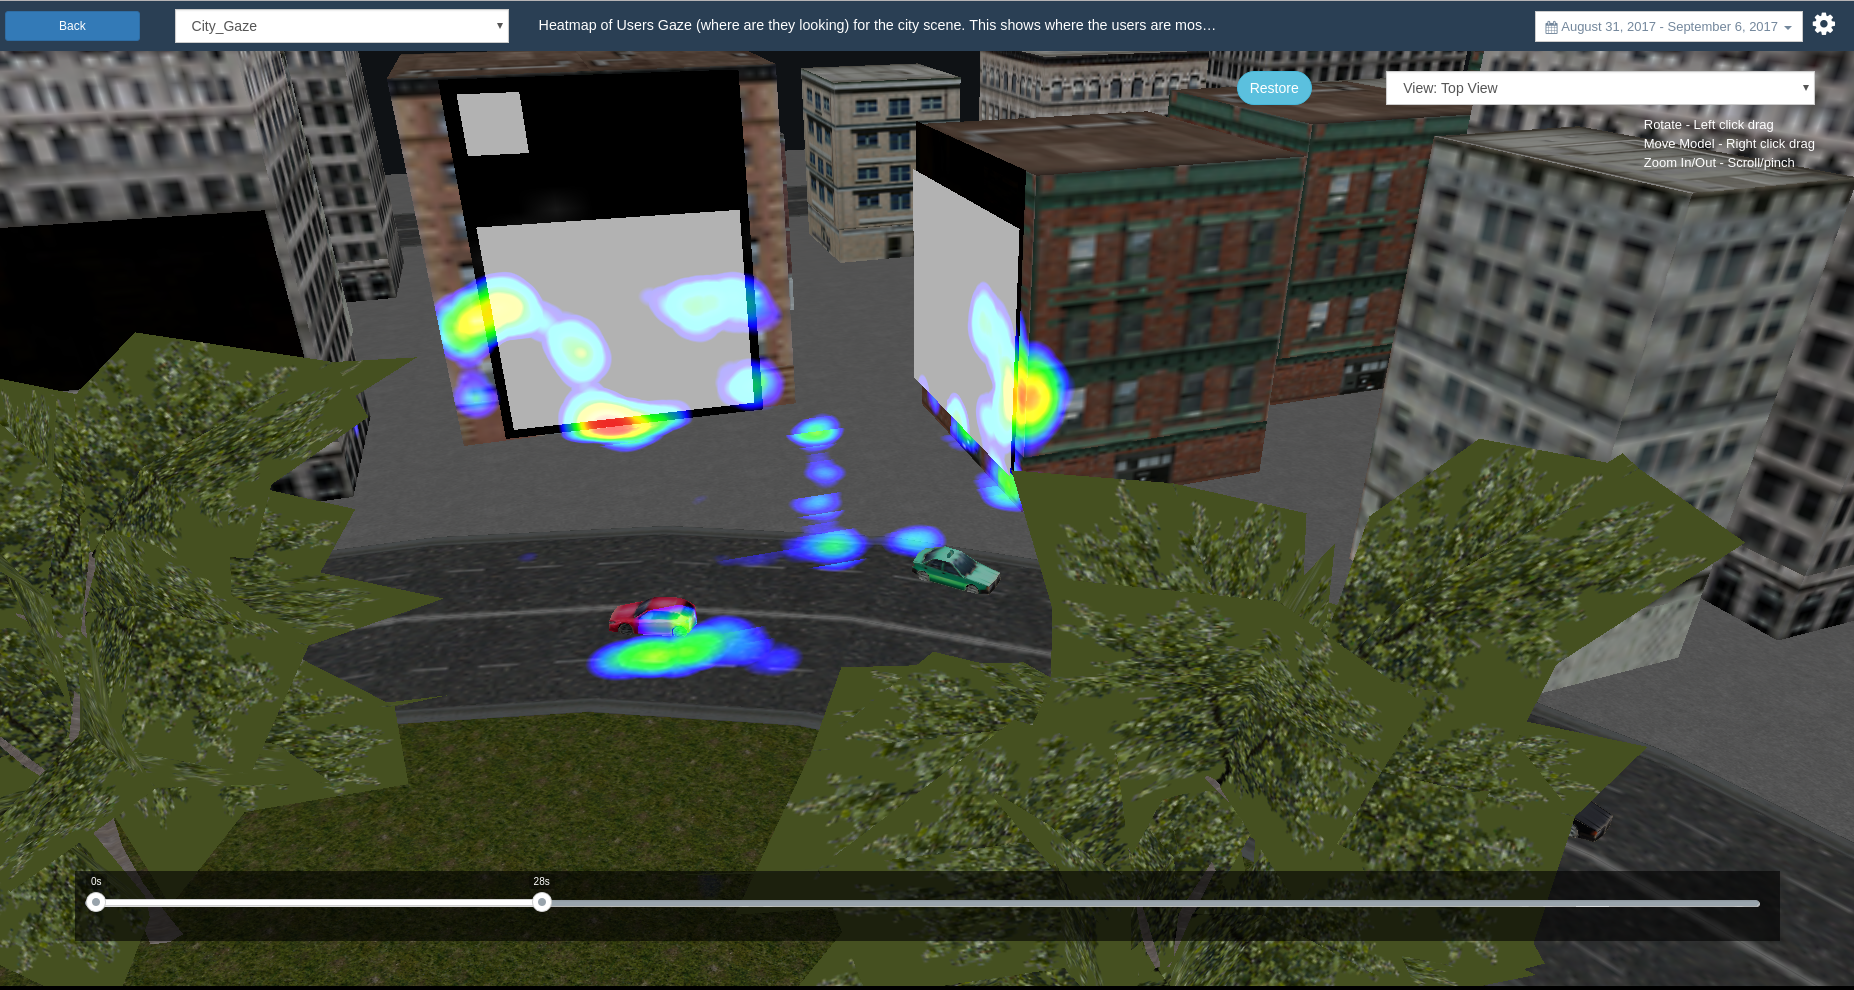
Fig: Users noticing billboards after changing position
- Line/Movement Map –This kind of heatmap is used to plot user movement information via lines. Inspired from map of nerves and neurons in brain, this heatmap presents movement via lines and stop points via cluster. The color change signifies the intensity of data. Plotting stop points and movement together lets you visualize areas of high activity and path taken to reach there together. You could also get other informations like dropoff points, users’ progress and even certain bugs. For instance in an application VR Safari, (having both automated and manual movement) it could be infered that majority of users were opting for automated movement. Further developer could also point out an issue where he forgot to put a collider and a small fraction of users were falling of the terrain. Further as the level progres users started dropping-offs with very few remaining till the end.
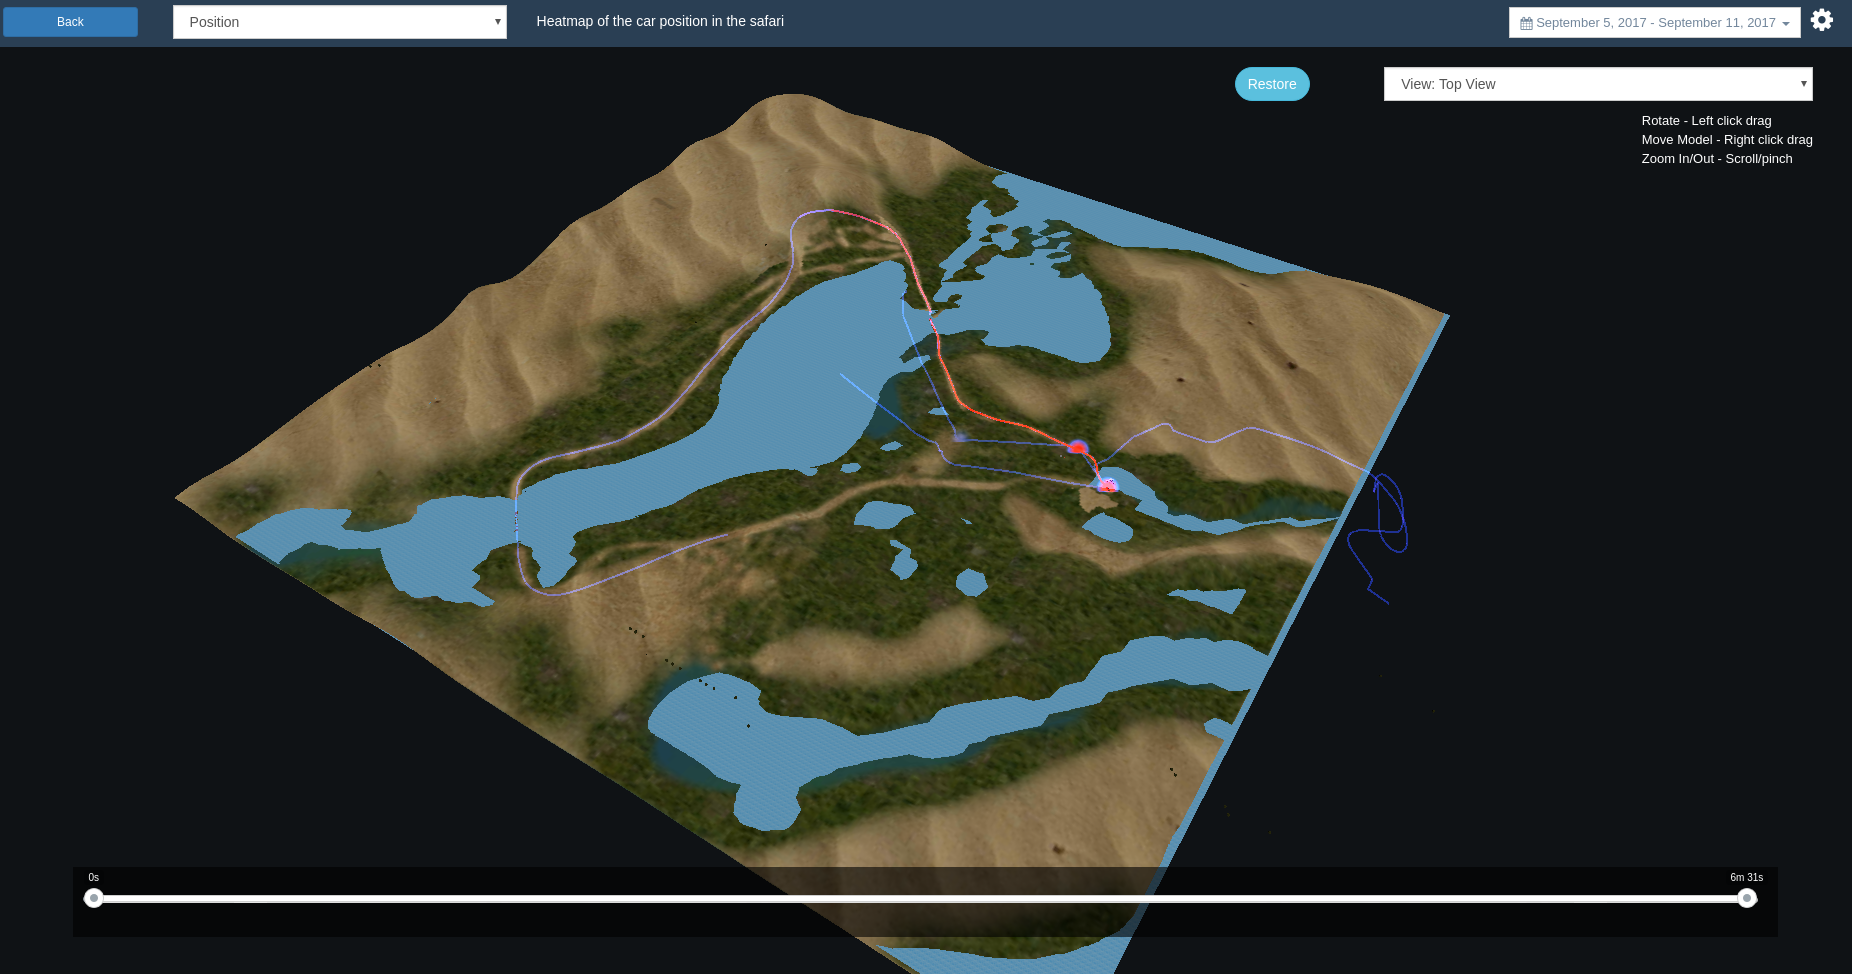
Certain users falling off the terrain in VR Safari
- Cluster Map – This kind of heatmap looks similar to surface map but the difference is in this data is not only plotted on the surface of the 3D model but also for information that lie in the air. This kind of heatmap is ideal for custom data in an application. For eg; location of enemy kill in a FPS game, or airplane crashes in an aircraft simulator, etc.
Final Thoughts
VR is new medium and different from web and mobile. Hence it needs different solution for analyzing user behaviour. Assigning position to each event enables us to visualize data as heatmaps. But heatmaps is not panacea to all the requirements of VR analytics. Some of the drawbacks of heatmaps are
- For small amount of data heatmaps are not effective.
- Heatmaps gives a great qualitative picture of the data but it is difficult to get quantitative information from them.
Though if used effectively they can provide deep insights into user behaviour. As Virtual Reality progress better tools to analyze and interpret user behaviour needs to be developed. This would help developers to adopt their content based on the feedback received from the data and keep their users engage.