Posted on 16 February 2017 by VRperception in VR News, VR Softwares
Why VR Analytics is Important?
February 16th, 2017 – The Open VR Analytics platform by VadR
Analytics for apps or websites currently do a great job of letting you know the problem. They can assimilate the information about the user’s journey. How long were they using the content, how far ahead were they and when did they stop using it. However, it still begs a basic question, why did they drop off? We are left guessing and making the most probable conclusion.
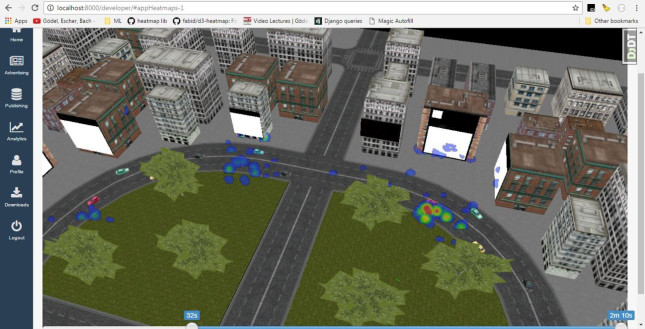
VR is entirely different; it has shifted analytics from numbers and analytical models to engagement and feelings. There is more human in VR analytics. With VR analytics, you are not only searching for patterns in data to make educated guesses, but are looking at users’ as unique individuals. You can understand each user’s feelings and reactions to content shown to him. This gives you much more credible and critical information to understand the user to depths never before achieved. With critical information such as how the user is interacting with his surroundings, where is he looking and where is he moving, we can gain meaningful insights about the users cognitive processes. VR can also help us interact with the data in an entirely new manner. You can visualize the information as heatmaps overlaid on your model. Heatmaps gives you the complete picture of what your users are most interested in, what is distracting them, etc. This couldn’t be achieved from traditional analytics solutions.
VadR Analytics features :
VadR analytics offers you a mix of traditional and innovative features, which are specifically tailored for VR. This helps you understand how users are interacting with your content and increase user engagement.
- Easy to Integrate: It’s a simple drag and drop SDK that will immediately start churning out data for you. It takes just 120 seconds to integrate.
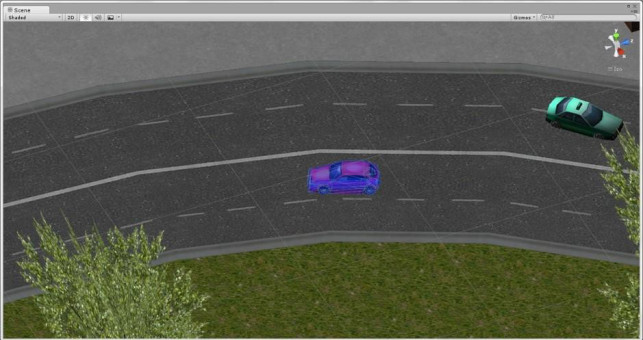
- User Tracking: With VadR Analytics, you can track users’ gaze and position. These tell you where exactly the user has been looking and moving. This information can be visualized as Heatmaps, enabling you to locate points on interest over the entire map at once.

3. Open and Flexible Architecture: With VadR analytics, you can customise the platform according to your needs and view any custom metric that you like. This will help you understand the factors affecting your content better, and pinpoint precisely the reason for certain behaviour of users.
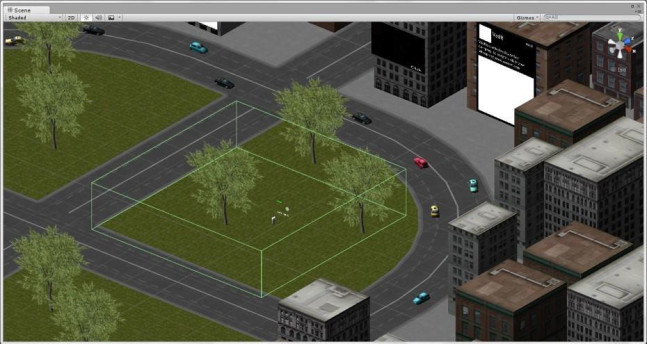
4.Object and volume tagging: You can define volumes in your VR content and run very specific analysis on those volumes, like the no. of users in them, the time spent, their entry and exit points etc. You can also tag object to understand the users’ interaction with them.


5. Default Metrics – We offer metrics such as no. of sessions, geographical location, CPU usage, FPS rate etc. to make sure that the base is present in order to build upon it.
6. Easy Interpretation – With VadR’s platform any metric can be visualized as Heatmaps overlaid on your model or as graphs. A combination of these two gives a holistic picture.
Future Developments
Going ahead, we are going to include many more features and make the platform far more intelligent in order to identify automatically the features of the content and suggest the best metrics for you.
We are developing behavioural analytics to help you gauge the user reaction, whether they are happy, sad, excited etc. We are also making the platform intelligent to identify volumes and objects directly and show them to you to give further easy access to information. We will be aggressively updating features and making sure that the VR industry is able to enjoy them the best.
You can access the platform by signing up at www.vadr.io