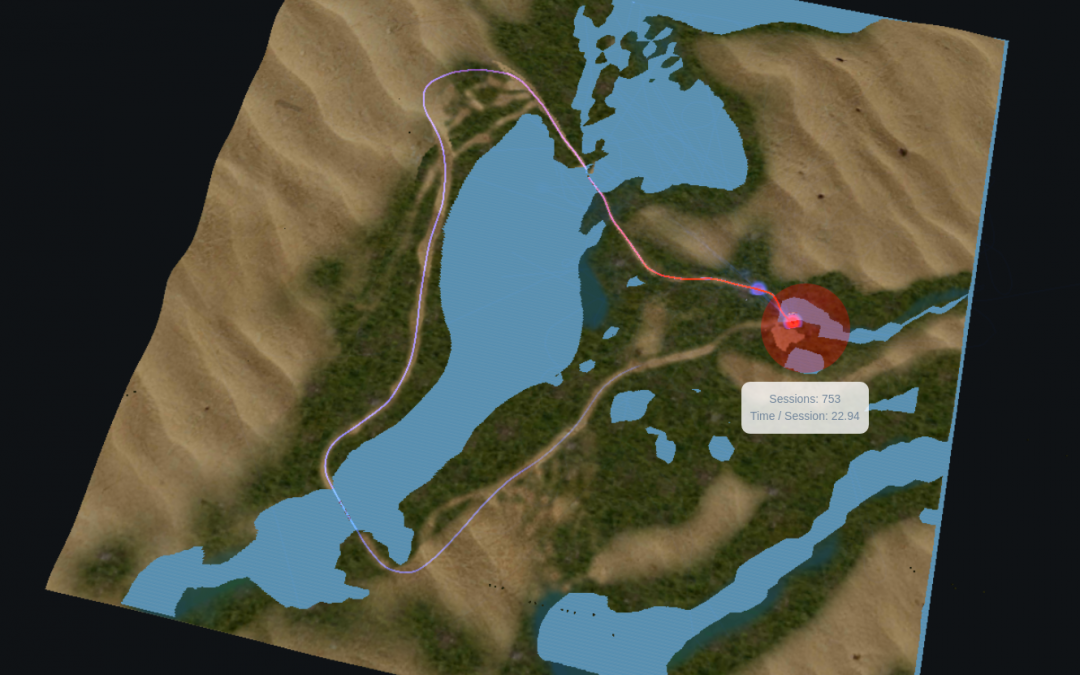
Analytics without derivable insights is not useful. Insights tell us what to do with the data that we have and how to improve the content at hand. However, a lot of times without the correct data, getting the right insights is not easy. VadR has recently introduced the movement maps. This tells us where and how the users are moving in the VR environment. This although is a very powerful indicator of the usage patterns, (Read about it here), it fails to tell us a quantifiable nos. Similarly other heatmaps are great to get qualitative information but not quantifiable nos.
With the help of our new tool, MapScanner, you can view quantitative data for any heatmap. This helps into what is next course of action that needs to be taken and what to target at the start. For example, if you know that no. of people finishing a particular level in a game are just 10%, and you also know that retention rate has touched 30%, you can decide which problem you want to tackle first based on which is a bigger problem, which has been quantified for you.
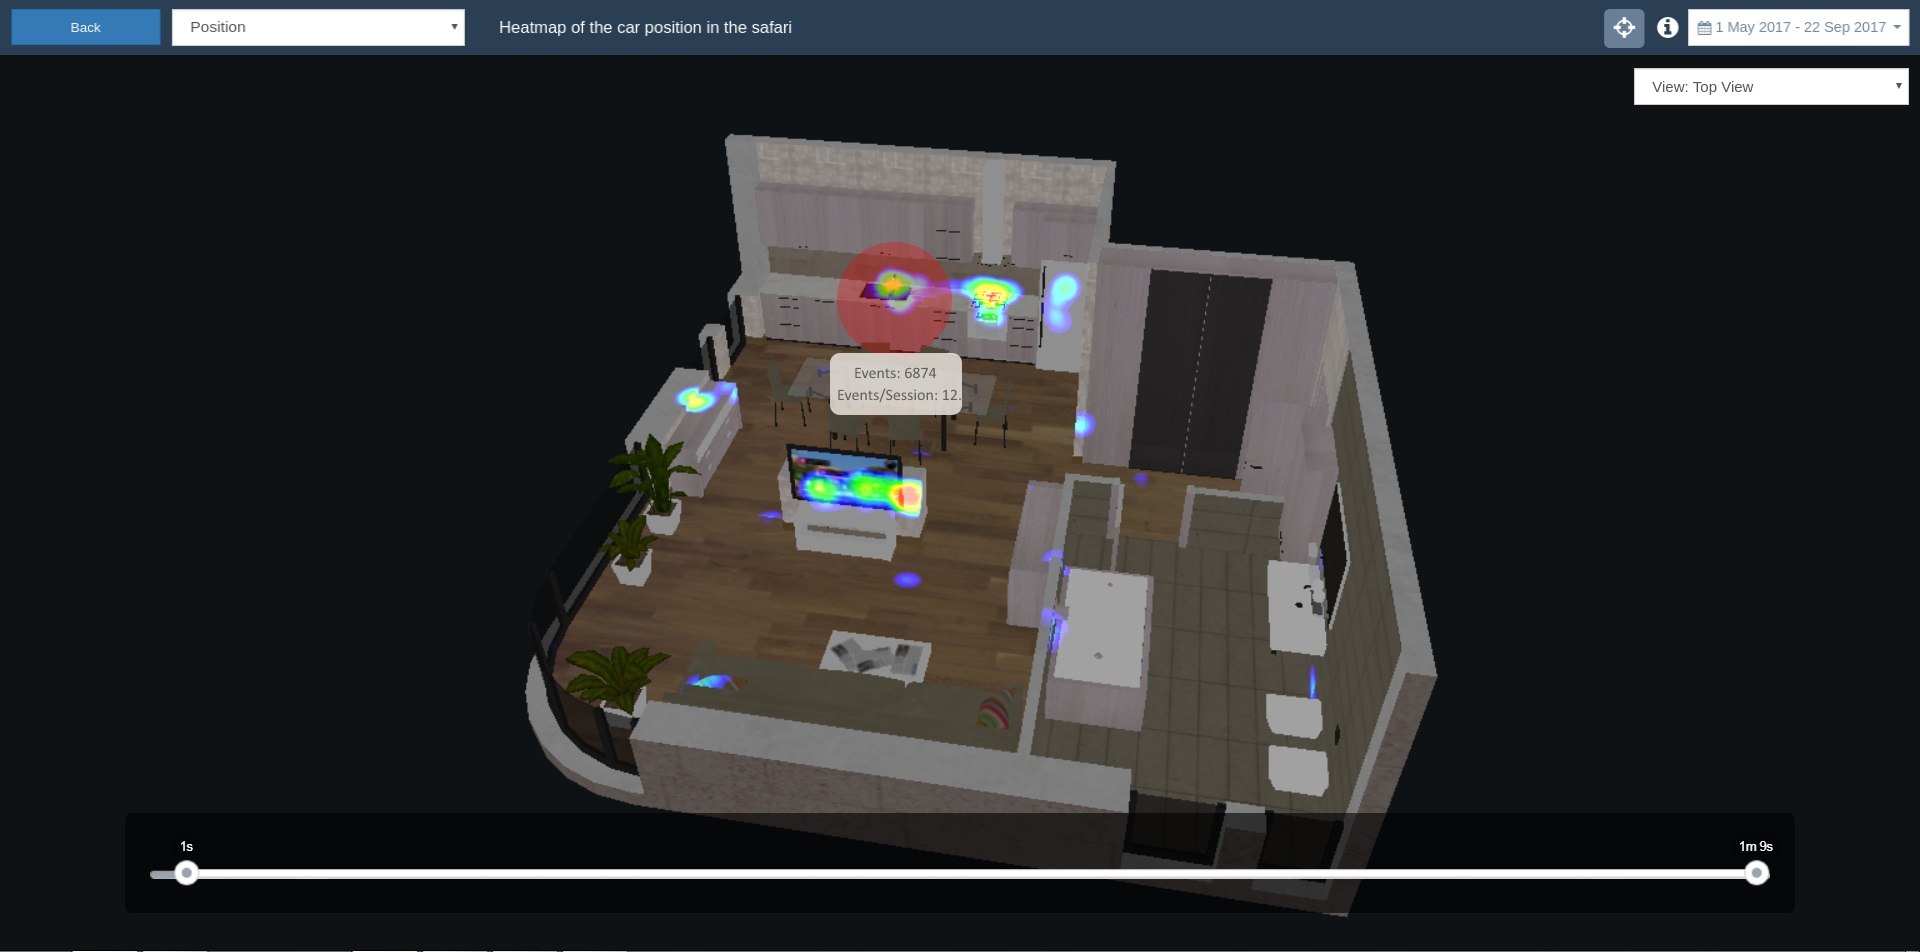
Applying this to custom events is even more beneficial. Tracking relevant metrics for each content has potentially much higher impact. Knowing data and underlying co-ordinates of any event has immense benefit. Like in a Virtual Showroom, if you know that checkout rates of certain item is higher, and also these items location, then you can know if the items played a role in the checkouts or was it the location. In the example above we can see that the certain objects are being interacted with. We can here understand that since only a few major objects are being interacted with, they attract user attention. But, to what extent, this can be easily seen using the MapScanner tool.
With MapScanner, you will be able to not only visualize data spatially but also quantify the data and take decisions accordingly. Check out VadR’s complete feature set at www.vadrnet.com